Interactive IPC Map (2009–2023)
Explore how state immigration policy climates have shifted over time.
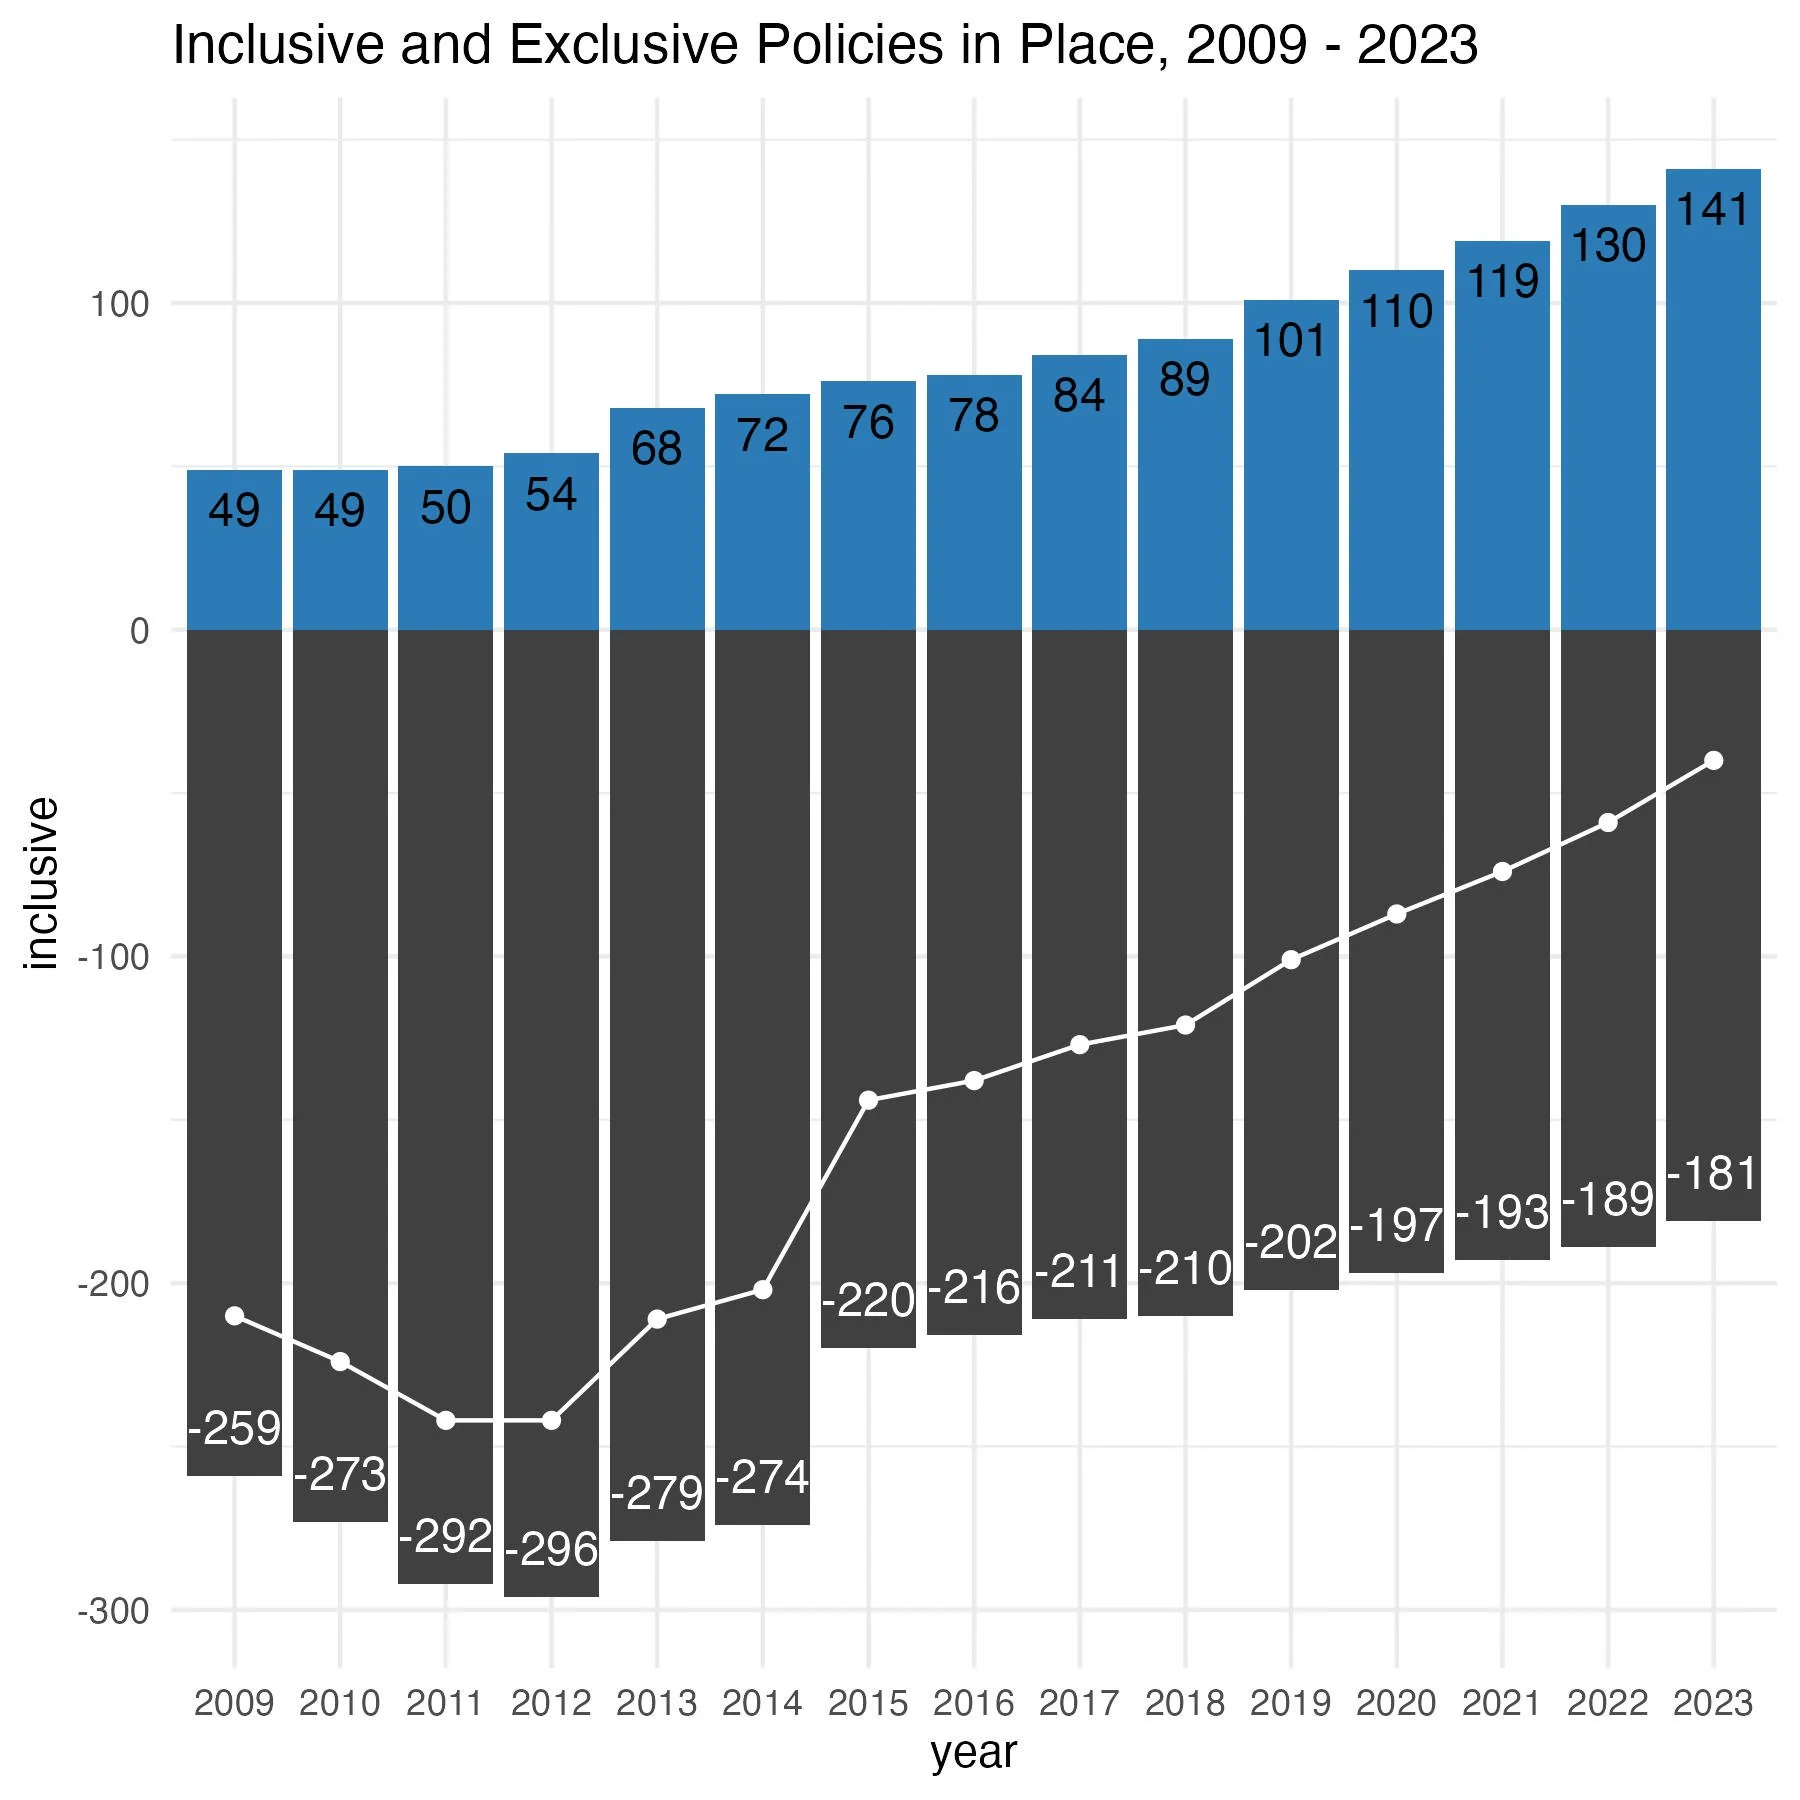
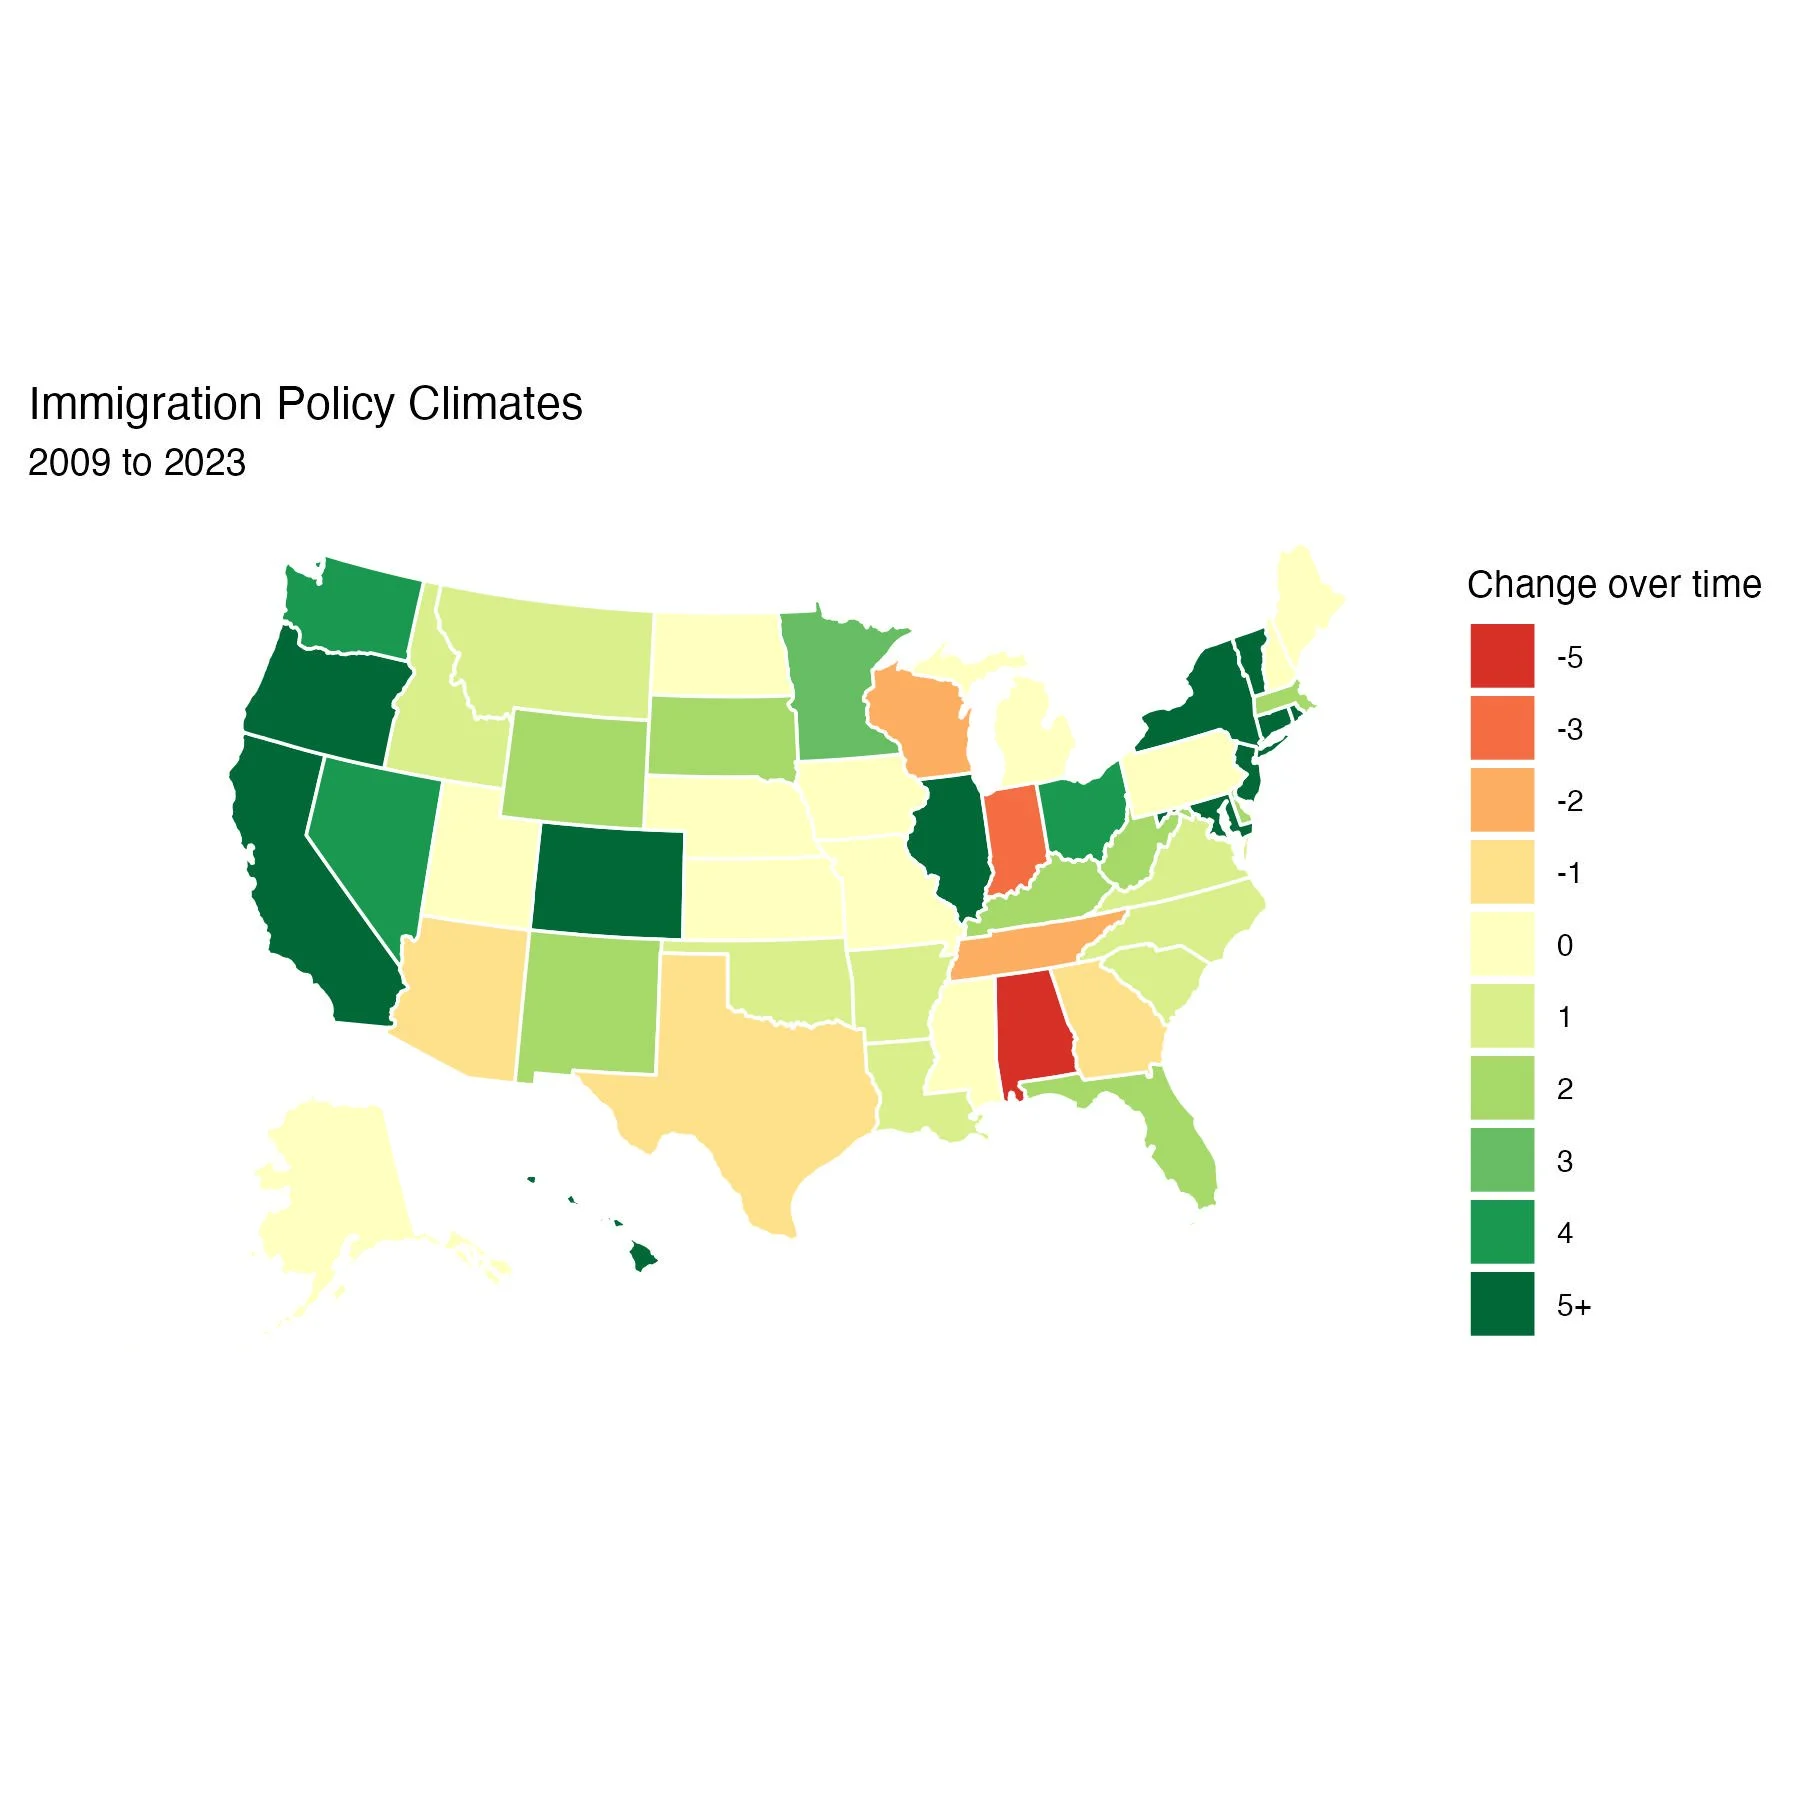
Note: IPC scores below zero indicate more exclusionary policy climates, while scores above zero indicate more inclusionary climates. Color scale reflects the total IPC score for each state in the selected year.
Key Insights
-
The mean IPC score for all states from 2009 - 2023 was -2.9.
-
Among the states that exhibited changes from 2009 to 2023, there was a general trend toward more neutral policy environments.
-
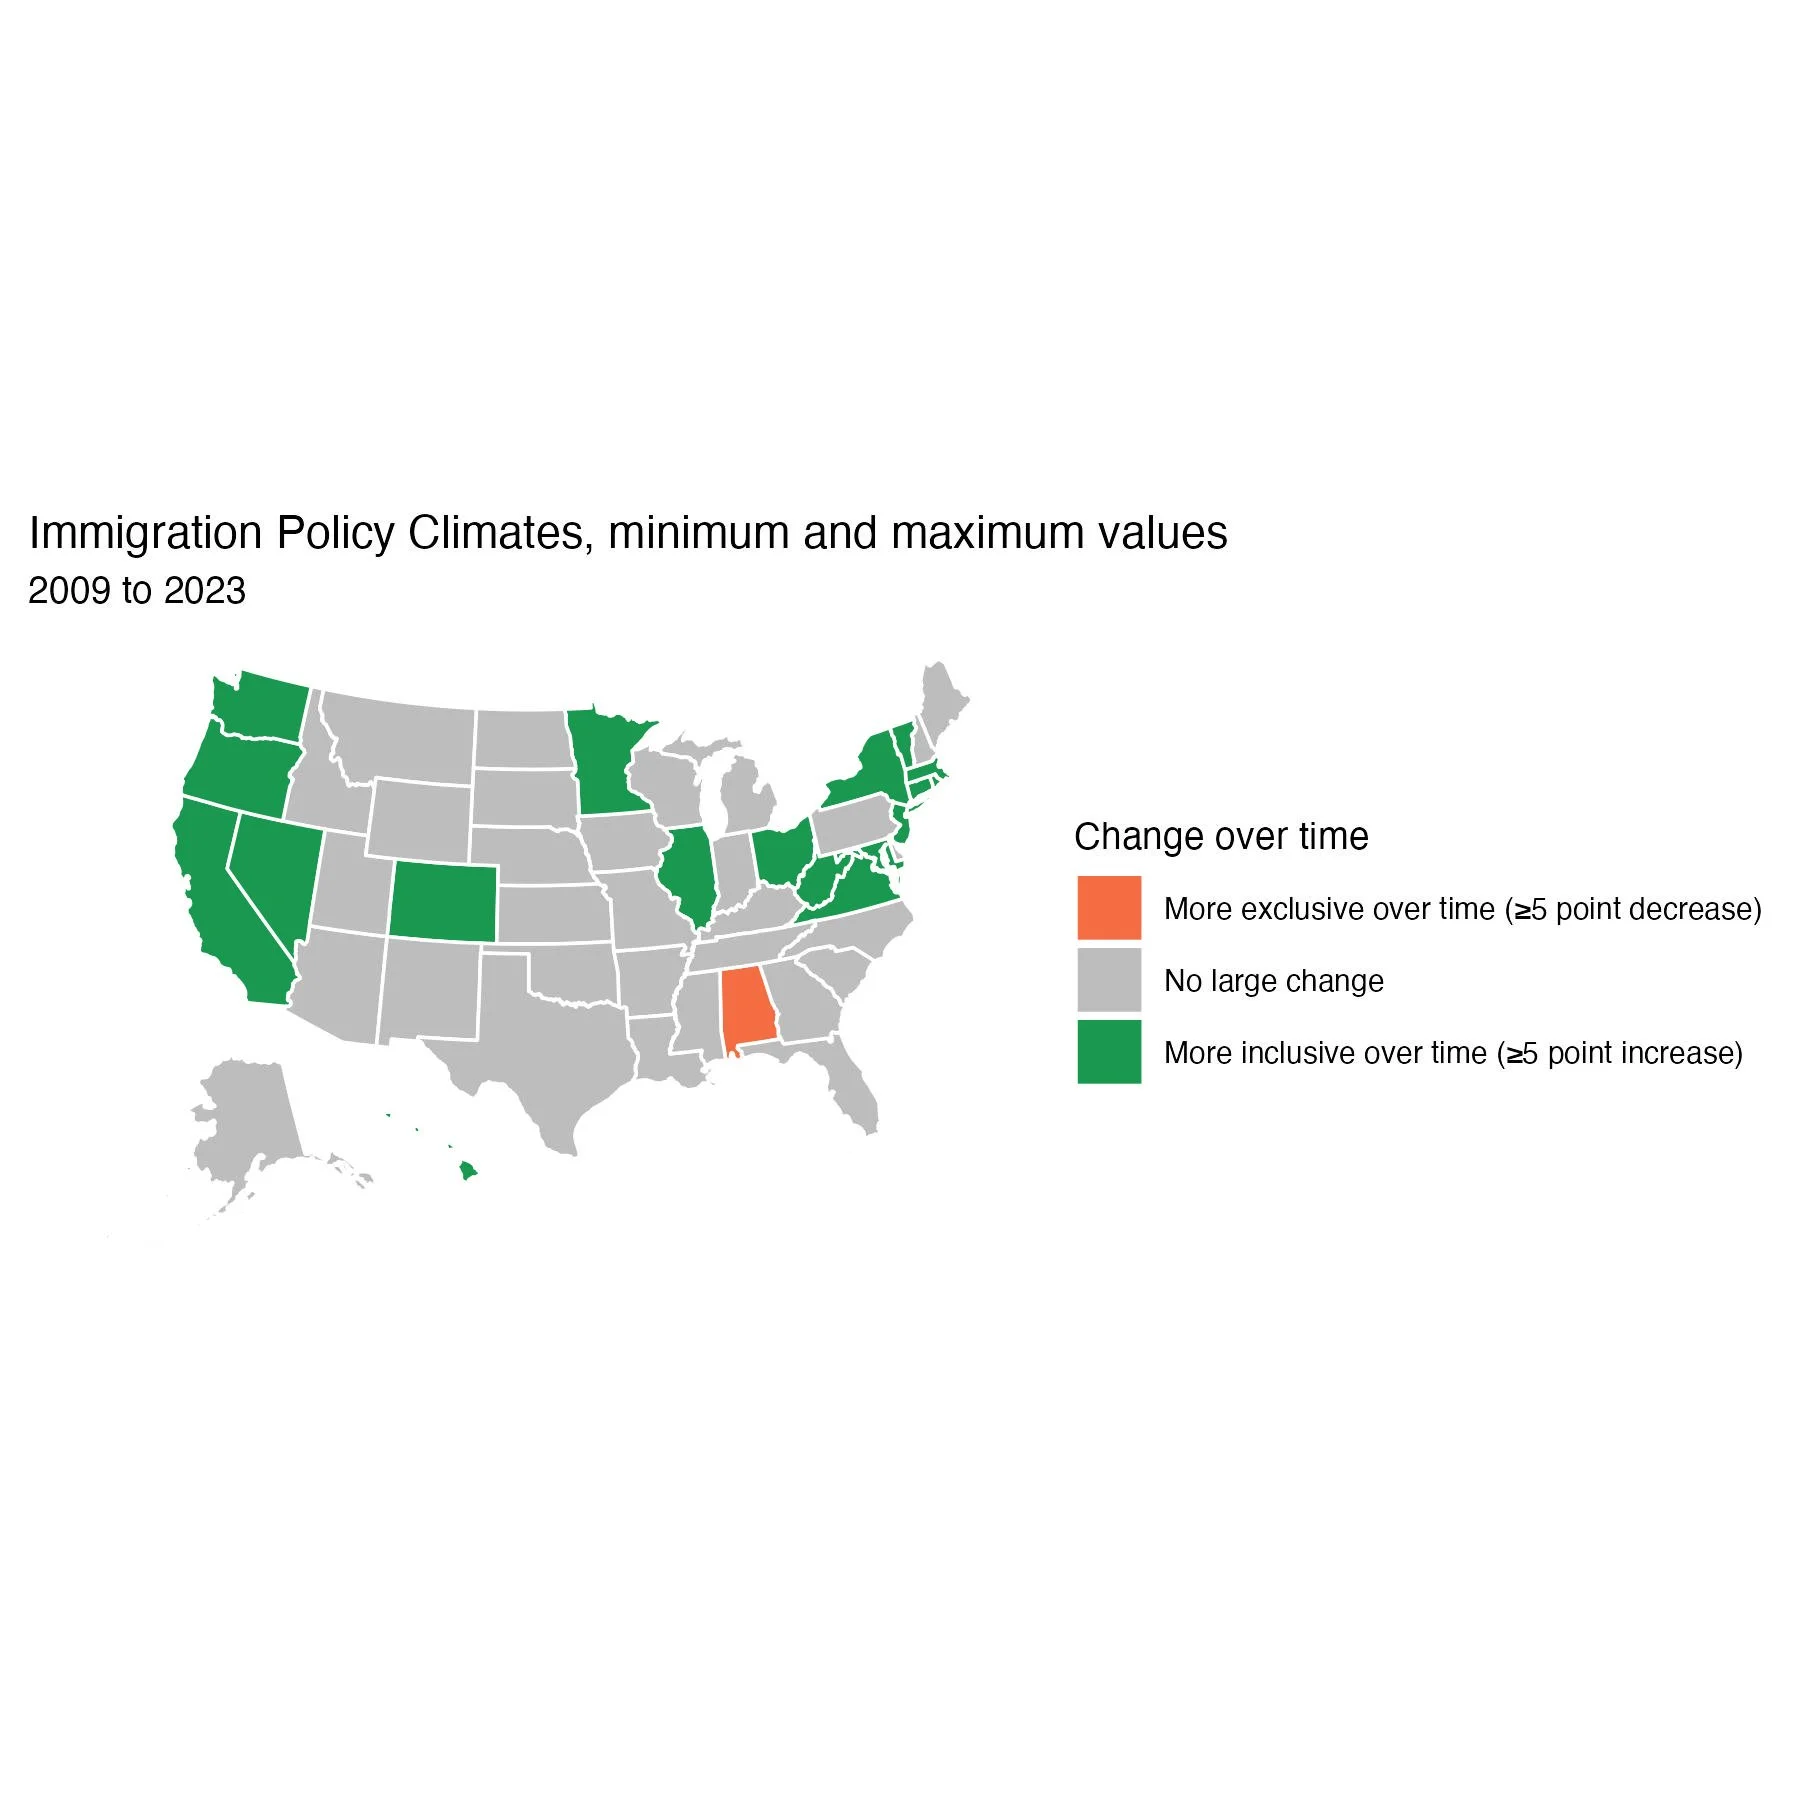
20 states experienced a meaningful change in their immigration policies over the period, with a 5-point or greater shift in their IPC score.
-
The mean IPC change over the entire period was -4, indicating that, on average, states moved in a more restrictive direction. However, by 2023, this trend slowed, with a -1 change in that year alone, suggesting that the rate of policy restriction has decreased.
